In April, the U.S. consumer price index rose less than expected, and retail sales data were also weaker than anticipated, increasing the likelihood of a Federal Reserve interest rate cut.
Supported by a weakening dollar and a decline in U.S. Treasury yields, gold prices surged by nearly USD 30, or approximately 1.18%.
Meanwhile, oil prices rebounded nearly 1% from a two-month low as the market weighed the positive U.S. economic data and oil inventory levels against the International Energy Agency (IEA)’s forecast of sluggish global oil demand growth.
Gold >>
On Wednesday, data showed that U.S. consumer prices in April rose less than expected, and retail sales data, often referred to as the “scary data,” were weaker than market expectations, increasing the likelihood of a Federal Reserve rate cut.
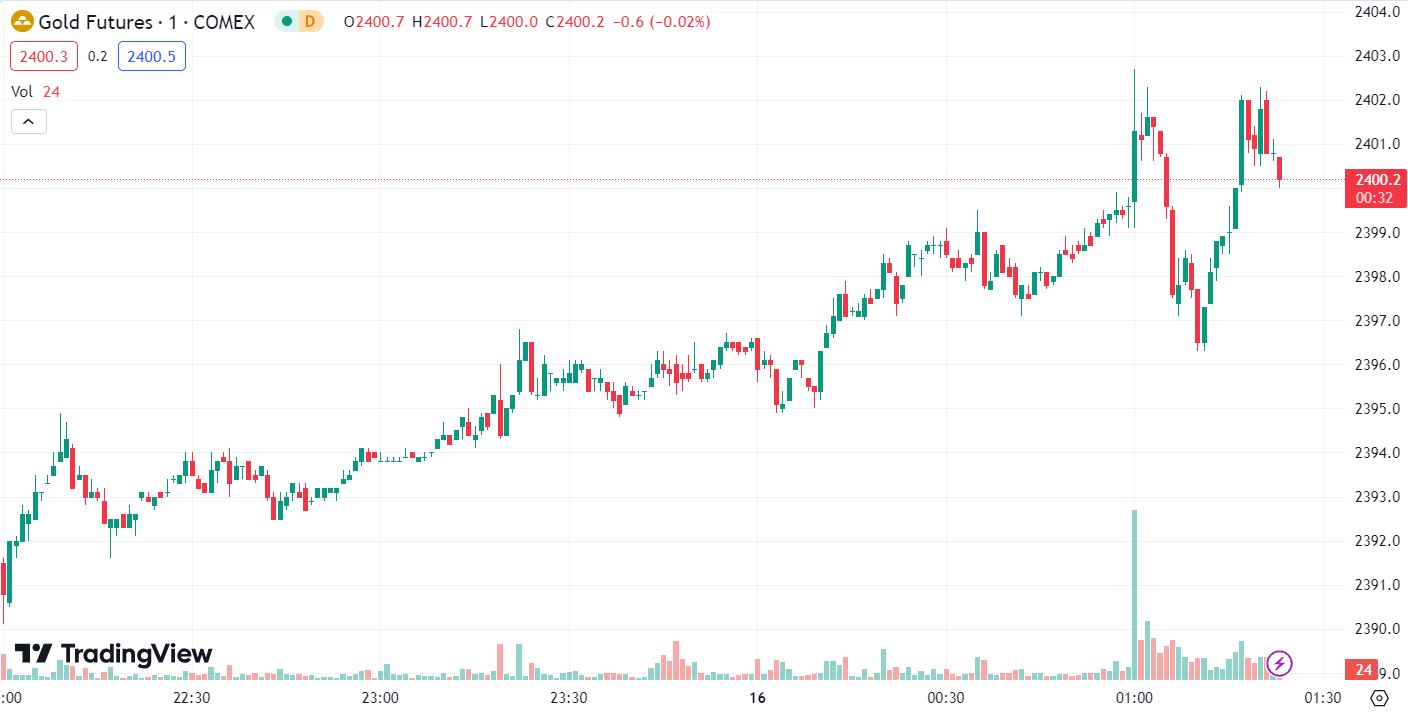
Benefiting from a weakening dollar and a decline in U.S. Treasury yields, spot gold briefly surged to an intraday high of USD 2390.09, marking a near one-month high, and eventually closed up 1.18% at USD 2385.67 per ounce.
The U.S. CPI rose 0.3% month-on-month in April, following a 0.4% rise in March, suggesting that inflation resumed its downward trend at the beginning of the second quarter, boosting financial market expectations for a rate cut in September.
The dollar index fell 0.6%, hitting its lowest level in over a month, while the 10-year U.S. Treasury yield also reached its lowest in over a month, making gold more attractive to investors holding other currencies.
Yesterday, gold continued its strong upward momentum from the 2350 level, exhibiting a pattern of strong oscillations. During the Asian and European sessions, it began a bullish trend, further accelerating in the afternoon to breach the 2374 level before a slight pullback.
In the evening, before the U.S. market opened, gold prices stabilized around the 2358 level, and following the favorable CPI data, prices quickly surged, breaking through the 2378 resistance before pulling back again.
After 10 p.m., gold prices retested and stabilized around the 2351 level, leading to a strong bullish rally that pushed prices higher. By early morning, gold prices had strongly closed above 2390.
Technical Analysis:

Today’s short-term strategy for gold suggests prioritizing short positions during rebounds, with long positions considered as a secondary approach during pullbacks.
- Key resistance levels to watch in the short term are around 2405-2410.
- Key support levels to watch in the short term are around 2375-2370.
WTI Crude Oil >>
On Wednesday, as the market weighed positive U.S. economic data and crude oil inventory reports against the International Energy Agency’s (IEA) forecast for sluggish global oil demand growth.
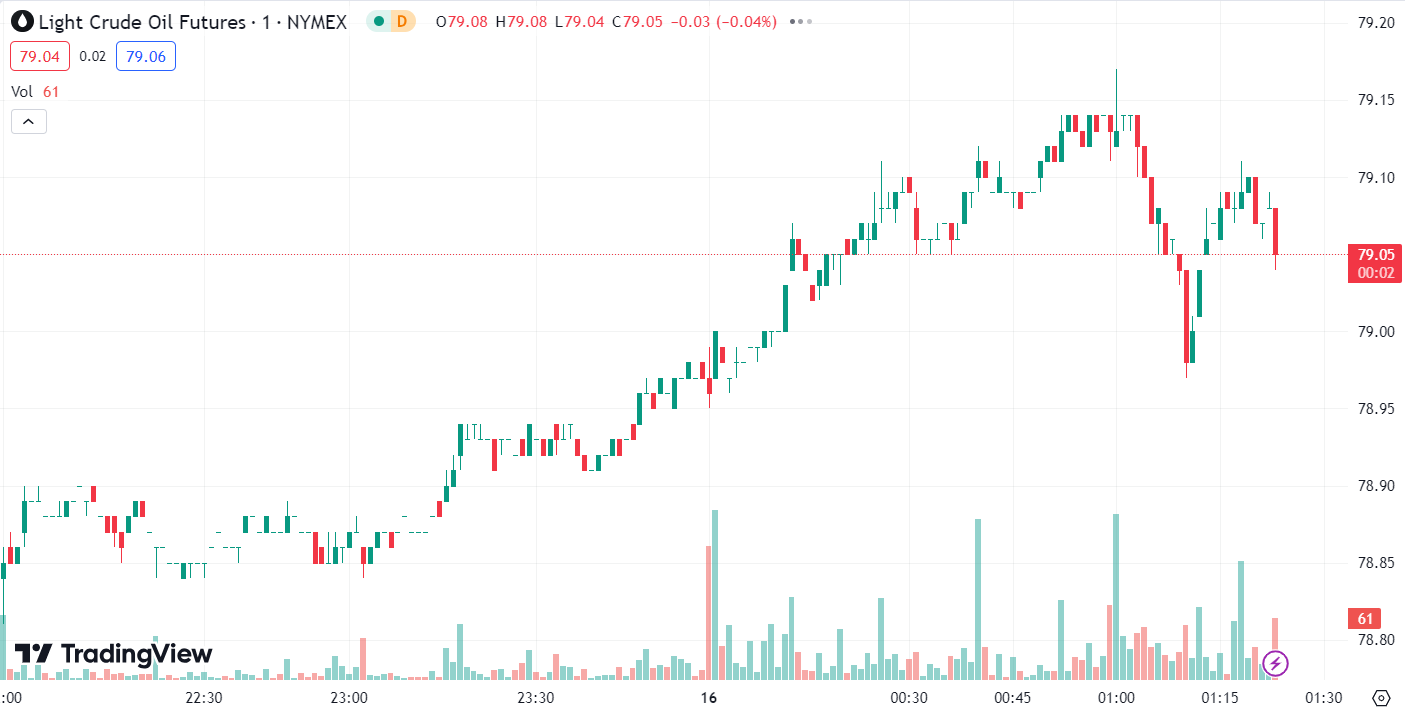
WTI crude oil briefly fell to an intraday low of USD 76.35 but recovered all losses during the U.S. trading session, ultimately closing up 0.46% at USD 78.39 per barrel. Brent crude oil closed up 0.26% at USD 82.67 per barrel.
Oil prices reversed direction after U.S. data showed a larger-than-expected decline in crude oil inventories and weaker inflation data, bolstering expectations of a rate cut later this year.
The U.S. Energy Information Administration (EIA) reported that U.S. crude inventories decreased by 2.5 million barrels last week, significantly more than the 500,000-barrel decrease predicted by a Reuters poll.
Meanwhile, the IEA lowered its forecast for oil demand growth in 2024, further widening the gap in outlook with OPEC regarding this year’s global oil demand prospects. Yesterday, oil prices exhibited a deep V-shaped recovery. During the Asian and European sessions, prices fell below the 78.8 resistance level, declining steadily.
In the evening, before and after the U.S. market opened, prices attempted to rebound but were pressured again at the 78.2 level, falling further to break below 77, reaching a low of around 76.7 before making a deep V-shaped recovery.
By early morning, oil prices had strongly rebounded, surpassing the early decline point of 78.8, closing with a bullish candle that indicated a recovery after a dip.
Technical Analysis:

Today’s crude oil trading strategy suggests prioritizing short positions during rebounds, with long positions considered as a secondary approach during pullbacks
- Key resistance levels to monitor in the short term are around 80.0-80.5.
- Key support levels to monitor in the short term are around 78.0-77.5.
Forward-looking Statements
This article contains “forward-looking statements” and may be identified by the use of forward-looking terminology such as “anticipate”, “believe”, “continue”, “could”, “estimate”, “expect”, “hope”, “intend”, “may”, “might”, “plan”, “potential”, “predict”, “should”, or “will”, or other variations thereon or comparable terminology. However, the absence of such terminology does not mean that a statement is not forward-looking. In particular, statements about the expectations, beliefs, plans, objectives, assumptions, future events, or future performance of Doo Prime will be generally assumed as forward-looking statements.
Doo Prime has provided these forward-looking statements based on all current information available to Doo Prime and Doo Prime’s current expectations, assumptions, estimates, and projections. While Doo Prime believes these expectations, assumptions, estimations, and projections are reasonable, these forward-looking statements are only predictions and involve known and unknown risks and uncertainties, many of which are beyond Doo Prime’s control. Such risks and uncertainties may cause results, performance, or achievements materially different from those expressed or implied by the forward-looking statements.
Doo Prime does not provide any representation or warranty on the reliability, accuracy, or completeness of such statements. Doo Prime is not obliged to provide or release any updates or revisions to any forward-looking statements.
Disclaimer
While every effort has been made to ensure the accuracy of the information in this document, DOO Prime does not warrant or guarantee the accuracy, completeness or reliability of this information. DOO Prime does not accept responsibility for any losses or damages arising directly or indirectly, from the use of this document. The material contained in this document is provided solely for general information and educational purposes and is not and should not be construed as, an offer to buy or sell, or as a solicitation of an offer to buy or sell, securities, futures, options, bonds or any other relevant financial instruments or investments. Nothing in this document should be taken as making any recommendations or providing any investment or other advice with respect to the purchase, sale or other disposition of financial instruments, any related products or any other products, securities or investments. Trading involves risk and you are advised to exercise caution in relation to the report. Before making any investment decision, prospective investors should seek advice from their own financial advisers, take into account their individual financial needs and circumstances and carefully consider the risks associated with such investment decision.


